Writing the Discussion and Conclusion
Week 10 · 2105620 Research Communication Skills for Chemical Engineers · 09:00–12:00
22 October 2026
What can the evidence support?
7 minutes · 09:01–09:08
- Write one finding with a number and a tested condition.
- Write one possible explanation and label it as a hypothesis.
- Tell a partner what evidence would separate the two.
The evidence we have
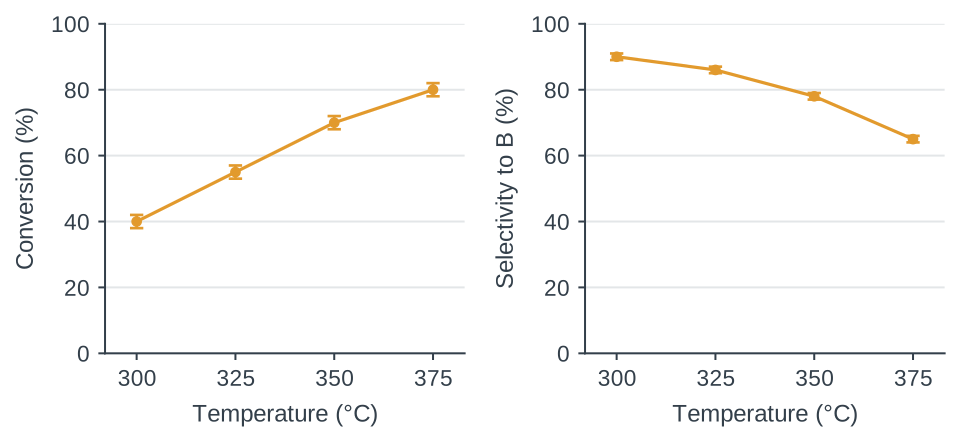
Synthetic means. Residence time 2.0 s, n = 3 per temperature. SD: X = 2 pp, S = 1 pp.
The research question guides the Discussion
Research question
How does temperature affect conversion and selectivity at a residence time of 2.0 s?
Results answer
Conversion rises from 40% to 80%, while selectivity falls from 90% to 65%.
Discussion task
Explain what this trade-off means for choosing a condition, and what remains unresolved.
Claim, evidence, reasoning and boundary
Claim: Conversion alone cannot determine the preferred condition.
Evidence: Higher temperature increases conversion but reduces selectivity.
Reasoning: Both quantities enter the desired-product yield in this case.
Boundary: Four temperatures, one residence time, three runs per temperature.
A paragraph with a visible line of reasoning
Conversion alone cannot determine the preferred condition. At 375 °C, mean conversion is highest among the tested temperatures, but mean selectivity is lowest. Because both quantities enter the desired-product yield, the highest conversion need not give the highest yield. The comparison remains limited to the four temperatures tested at 2.0 s.
Your check: Which sentence connects the evidence to the claim?
Conversion and estimated yield differ
| Temperature (°C) | Mean conversion (%) | Estimated yield (%) |
|---|---|---|
| 300 | 40 | 36.0 |
| 325 | 55 | 47.3 |
| 350 | 70 | 54.6 |
| 375 | 80 | 52.0 |
Estimate = mean conversion × mean selectivity / 100. Synthetic data.
At 350 °C: product of means = 54.6000%. Mean of the three paired-run yields = 54.5867%. Both round to 54.6%.
The best tested value has a limited scope
Observed
350 °C gives the highest yield estimate among the four tested temperatures.
Unresolved
Intermediate temperatures may give a different result. Uncertainty must also be considered.
Next decision
Test more temperatures near 350 °C before selecting a condition for further evaluation.
Competing explanations for lower selectivity
Hypothesis A: The desired product undergoes further reaction to byproducts.
Hypothesis B: A temperature-dependent sampling or analysis bias lowers the apparent selectivity.
Question: What would each explanation predict in an additional test?
These are hypotheses for the synthetic case. The existing trend establishes neither explanation.
A useful test has a predicted outcome
| Hypothesis | Proposed test | Predicted pattern if it contributes |
|---|---|---|
| Further reaction of the product | Vary residence time at fixed temperature | Lower selectivity and more byproducts at longer times |
| Analysis bias | Check known mixtures through the sampling and analysis procedure | Apparent recovery changes with the procedure or condition |
| Transport contributes | Vary mixing or particle size, controlling other factors | The response changes when transport conditions change |
A predicted pattern can support an explanation. One test rarely excludes every alternative.
Cautious wording still needs a reason
Incomplete: “The selectivity decrease may reflect a secondary reaction.”
Stronger: “A secondary reaction is one possible explanation. A residence-time test could examine whether lower selectivity accompanies increased byproduct formation.”
Still unresolved: The present temperature trend cannot distinguish this explanation from measurement bias.
A literature comparison needs comparable evidence
| Before comparing | Record from each paper |
|---|---|
| Are the systems comparable? | Feed, catalyst, reactor and operating range |
| Do the outcomes mean the same thing? | Definitions of conversion, selectivity and yield |
| What can explain a difference? | Measurement basis, uncertainty and study limitations |
10-minute task: Specify one comparison and the evidence you need to make it fairly.
Use a verified paper when available. Without one, write a search and extraction plan, without attributing an unverified finding to the literature.
Break
15
15 minutes
Resume at 10:30
A limitation should change the claim
4 setpoints
Limits resolution. Say “highest among those tested” rather than claiming a global optimum.
2.0 s only
Limits generalization. State 2.0 s when describing the temperature response.
3 runs per temperature
Variability is estimated from a small sample. Yield uncertainty needs the paired runs.
Industrial use
Energy use and stability remain untested.
Discussion connects evidence to a decision
Implication
The conversion–selectivity trade-off makes the choice of temperature depend on the objective.
Support
375 °C gives the highest mean conversion. At 350 °C, the yield estimate from the means is highest.
Boundary
This comparison identifies a condition for further testing. It does not establish an industrial optimum.
Discussion workshop
25 minutes · 10:40–11:05
- First 5 min: outline the claim, evidence, reasoning and boundary.
- Next 20 min: draft 250–350 words using your Results and figure.
- Include an alternative explanation and a test with a predicted outcome.
Success check: A reader can trace every factual claim to evidence and see what would change your interpretation.
The Conclusion answers the original question
Question: Does the paragraph answer the original research question?
Finding: Include the central comparison and its magnitude.
Scope: Name the tested conditions and the defensible implication.
Audit: Every result already appears in Results. Every interpretation has support.
A Conclusion linked to the research question
Main finding
At 2.0 s, raising temperature from 300 to 375 °C increased conversion from 40% to 80% and lowered selectivity from 90% to 65%.
Implication
Conversion alone cannot determine the preferred operating condition.
Next step
Testing near 350 °C could refine the yield comparison within this hypothetical system.
Conclusion workshop
12 minutes · 11:13–11:25
- Write 80–120 words answering the original research question.
- Include the central numerical comparison and the tested conditions.
- Check every claim against Results. Remove new results and unsupported promises.
Peer review of the argument
15 minutes · 11:25–11:40
- 5 min: mark the claim, evidence and reasoning in your partner’s draft.
- 5 min: check numbers, definitions, uncertainty and scope against Results.
- 5 min: write two edits, one for the reasoning and one for the scope.
Feedback format: “In sentence , change because the evidence shows __.”
A revision that changes the claim
Before
“The optimal industrial temperature is 350 °C.”
After
“Among the tested temperatures, 350 °C gave the highest yield estimate calculated from the reported mean conversion and selectivity.”
Final revision and submission
11 minutes · 11:45–11:56
- Submit Results, figure, caption, Discussion and Conclusion.
- Show one revision that better matches the evidence.
- Propose the next experiment and an outcome that would challenge your explanation.
20-point rubric: Data accuracy, claims and evidence, figure and caption, writing structure, transparency and reproducibility. 4 points each.
Writing guidance
- Journal instructions determine section structure.
- Check whether Results and Discussion are separate or combined.
- Use the target journal’s instructions before submission.
How was today?
Before you leave
Identify one point that is still unclear.
Name one change you will make in your writing or figure.
Complete the short anonymous feedback form.