The scientific question determines the display
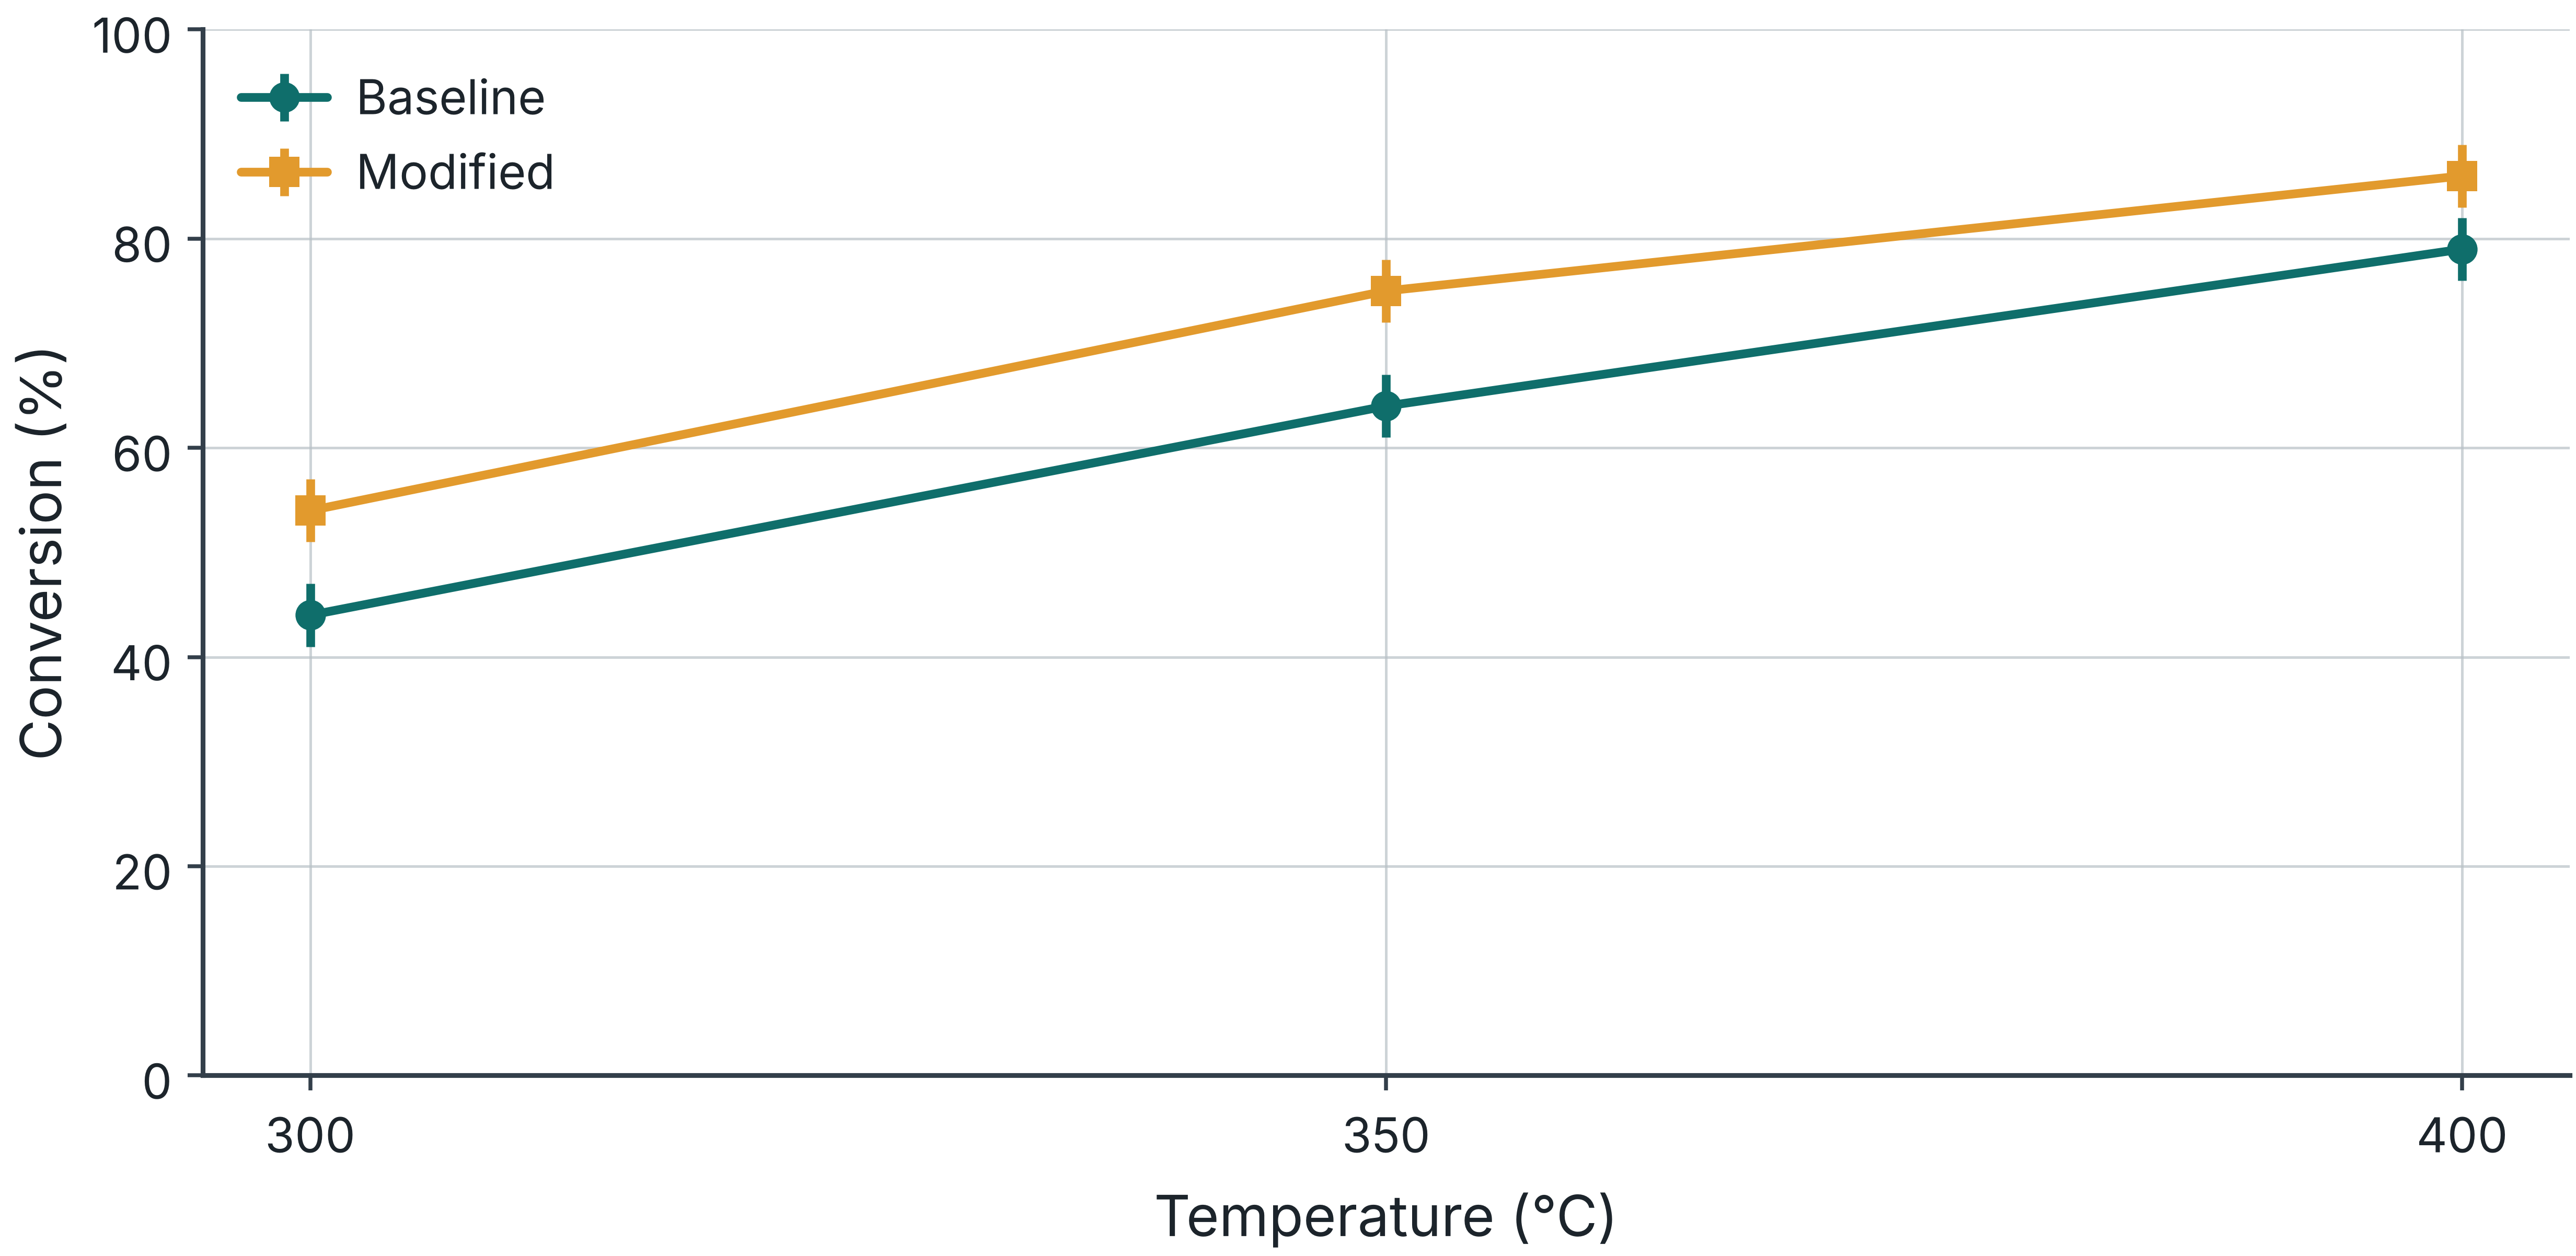
01Temperature dependence: a response plot
02Independent variation: raw points with a summary
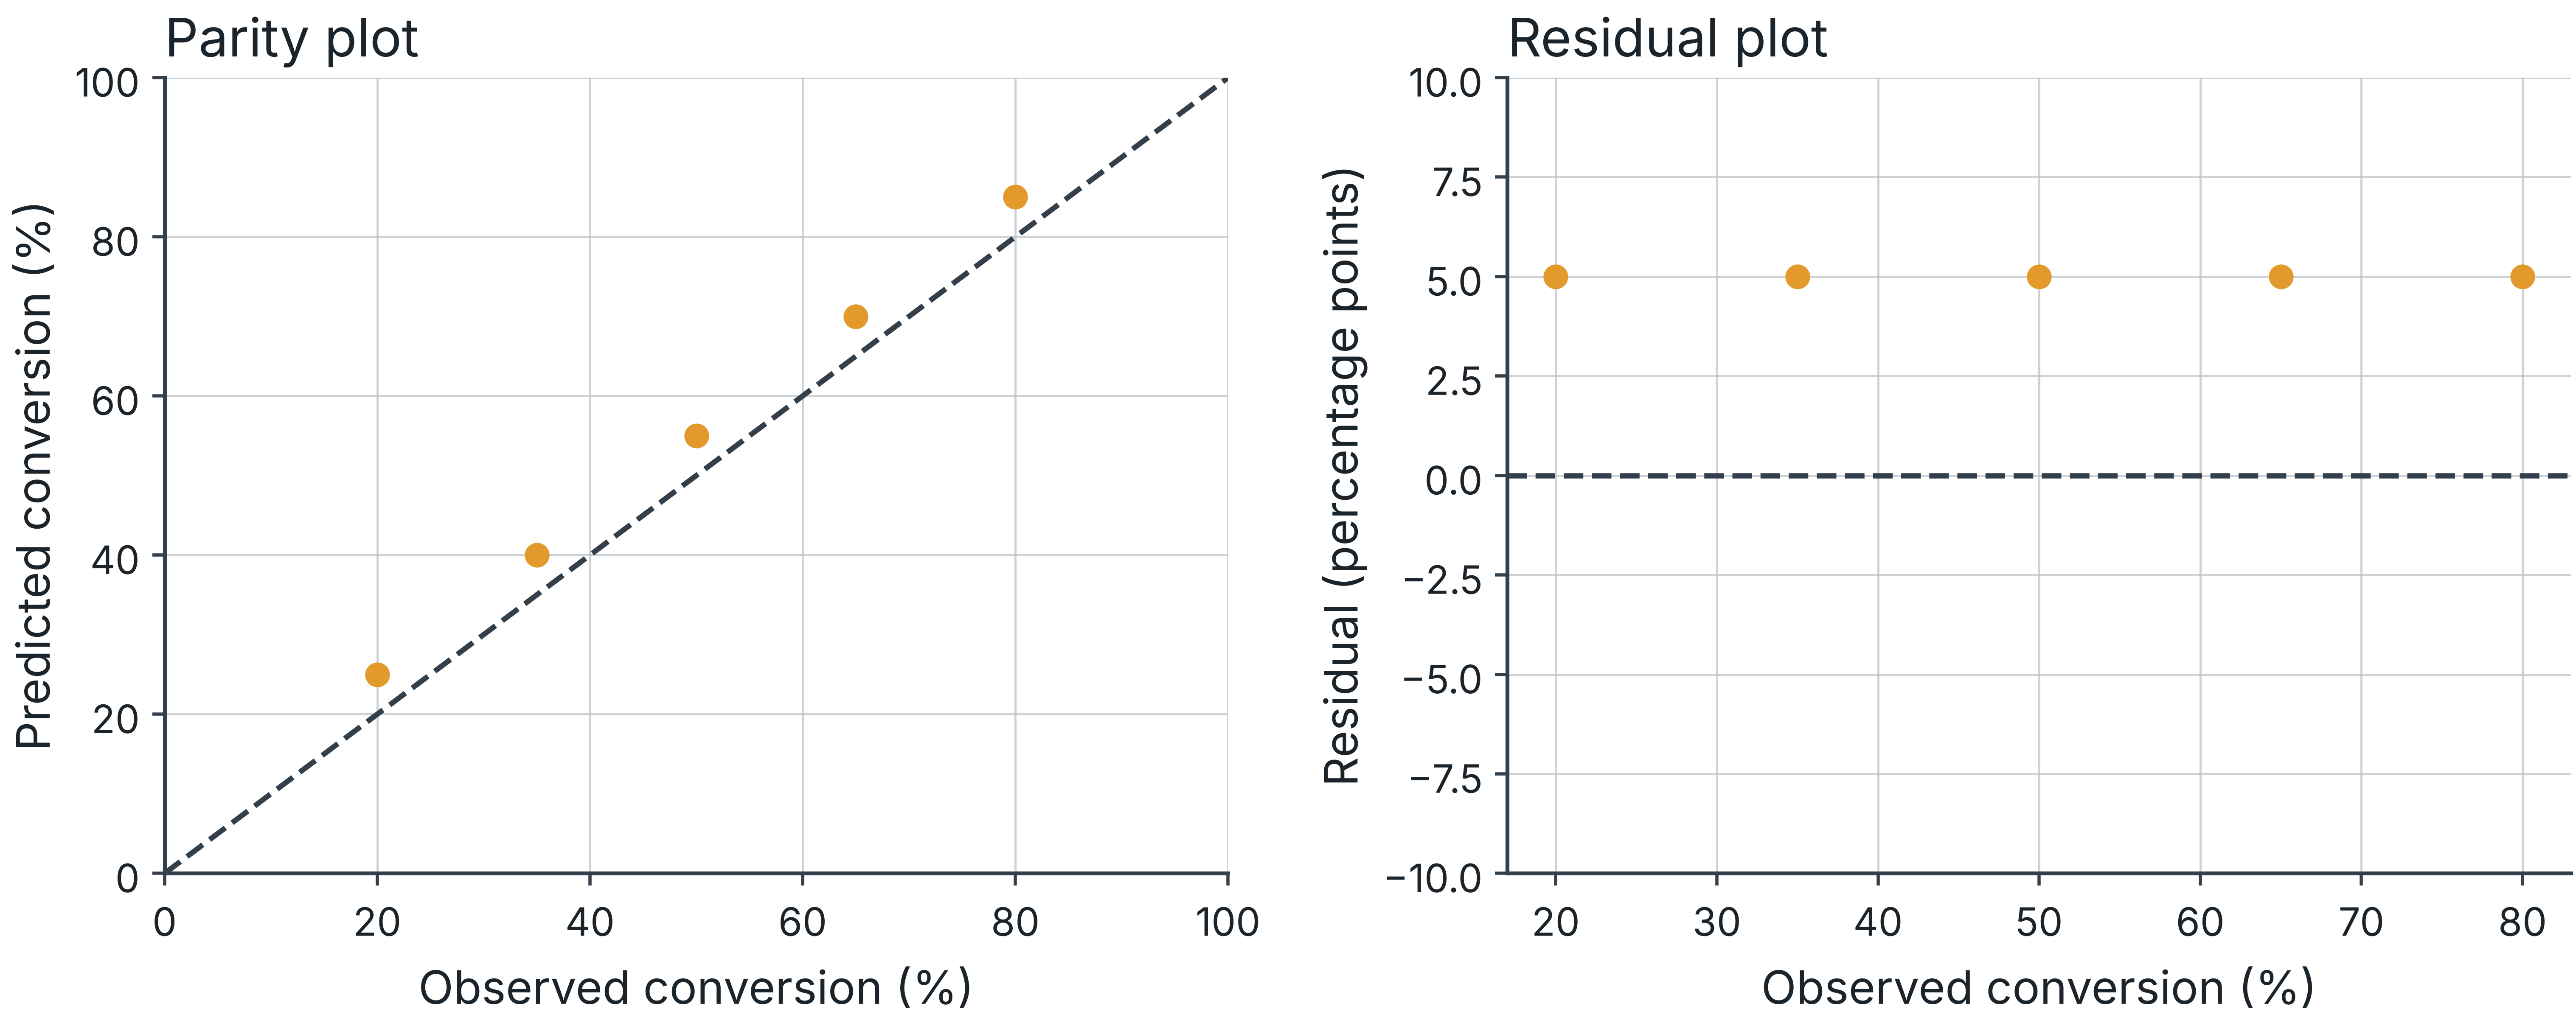
03Prediction quality: parity and residual plots
04Exact conditions or values: a table
Conversion and yield support different claims
| Conversion (%) |
64 |
75 |
| Selectivity to P (%) |
89 |
87 |
| Mean yield to P (%) |
57.0 |
65.2 |
Synthetic paired run data. Yield = conversion × selectivity / 100 for the stated 1:1 molar basis.
A caption that defines the evidence
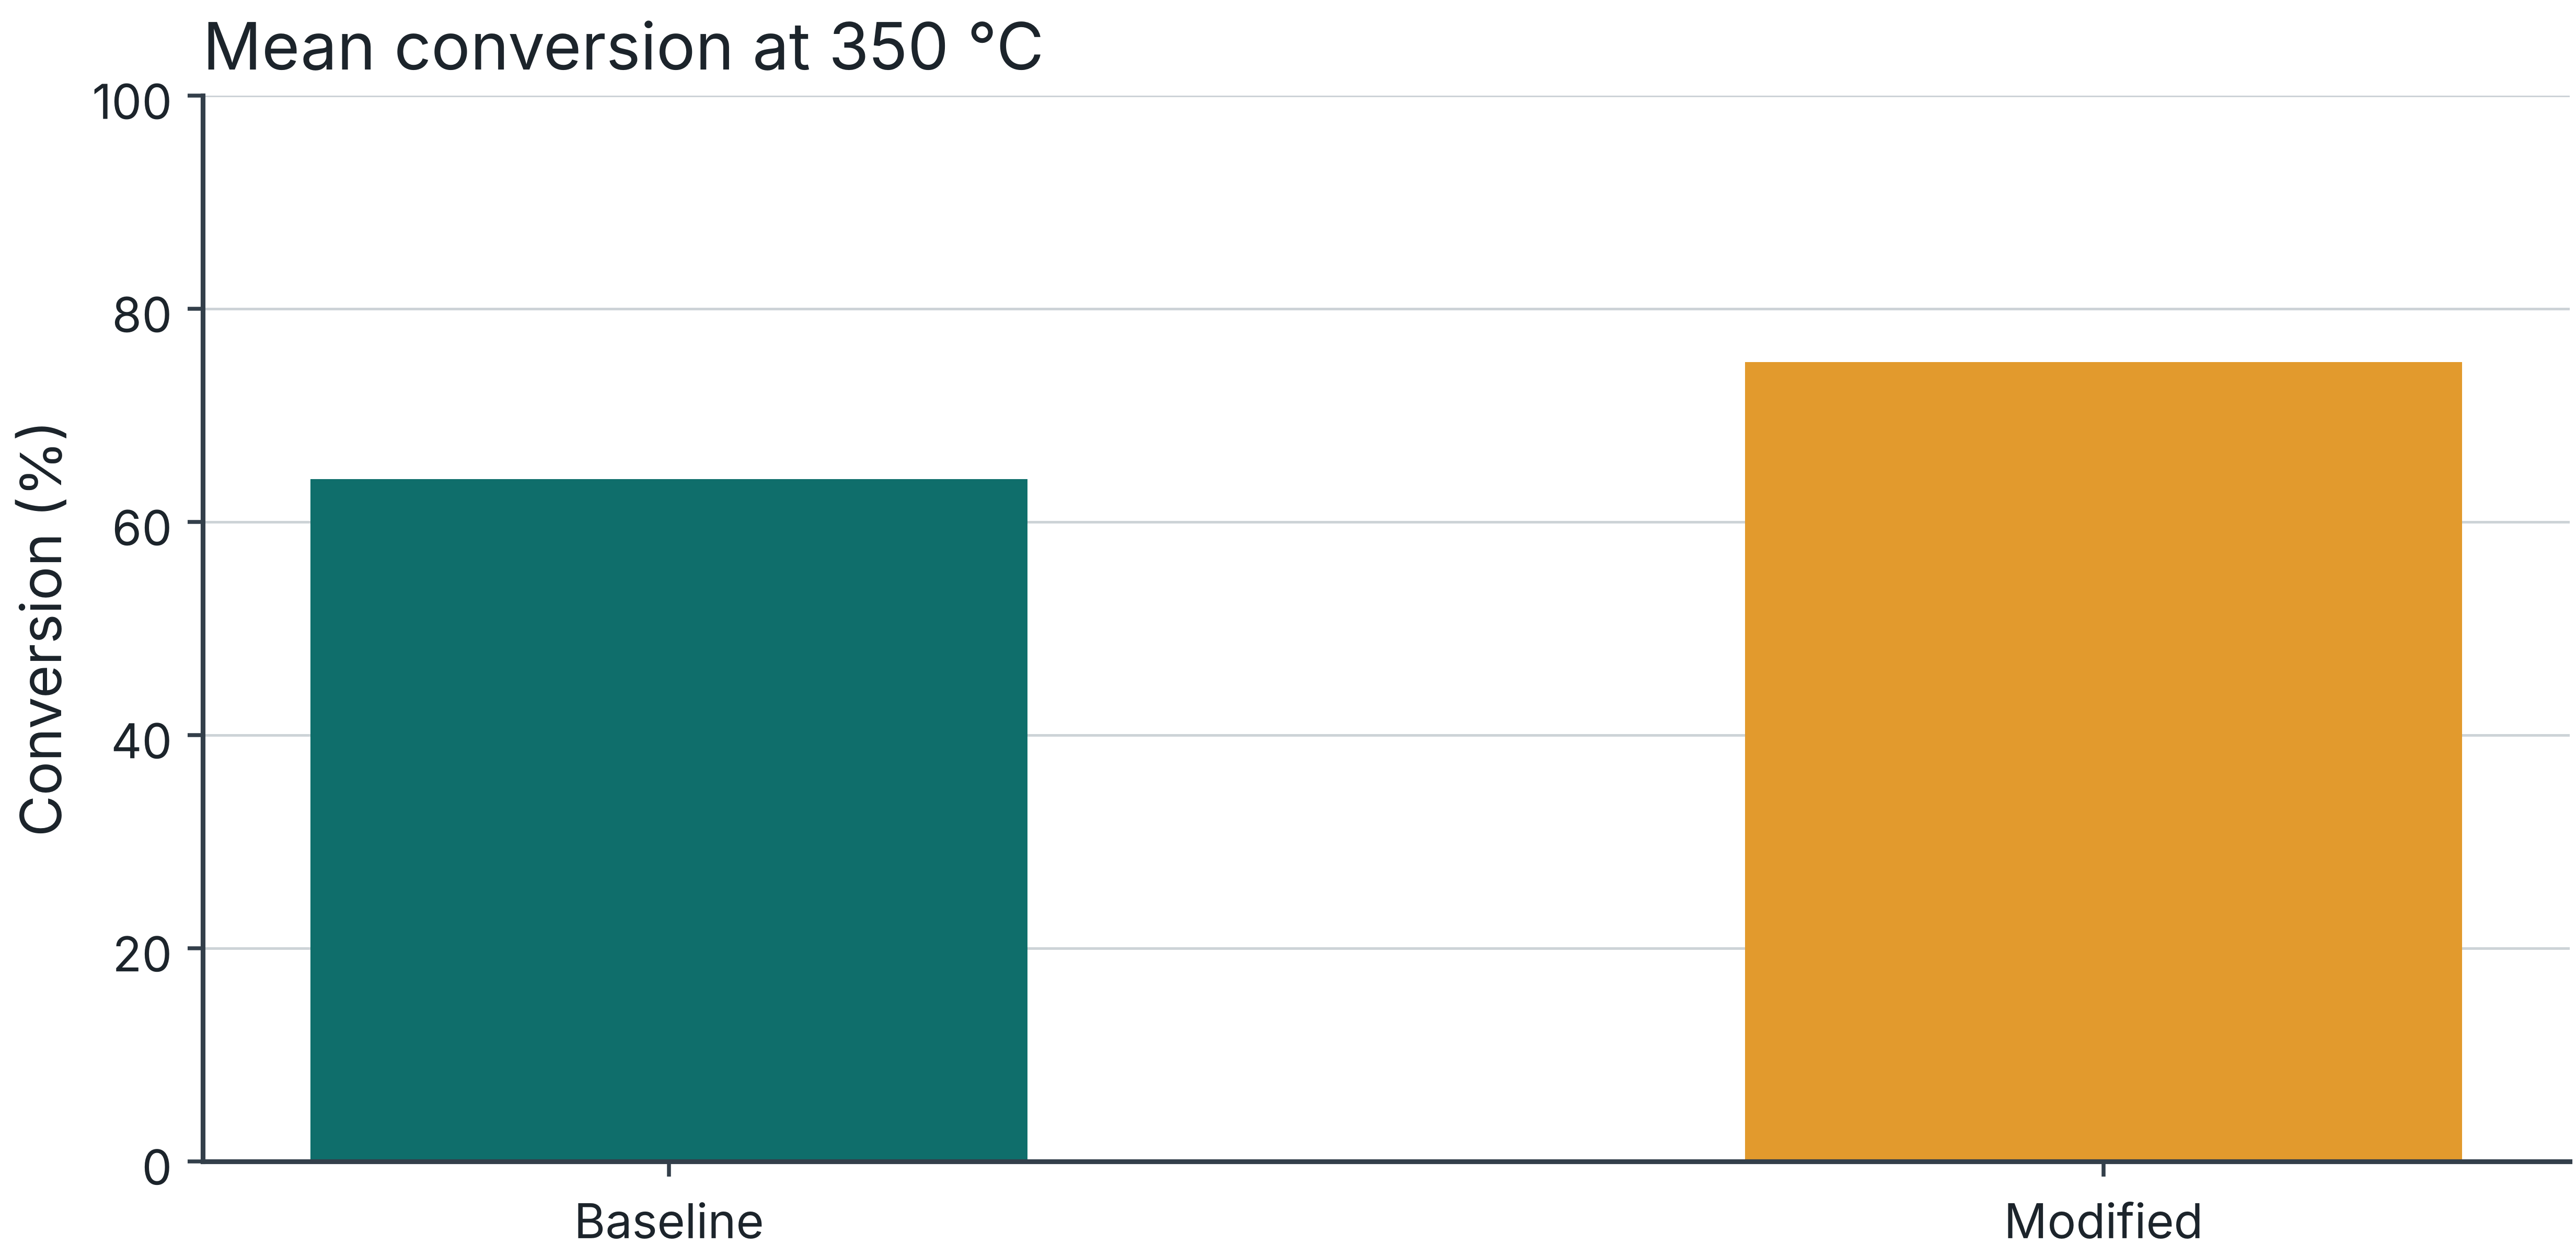
01Conversion at 350 °C for baseline and modified catalysts under matched feed and flow conditions.
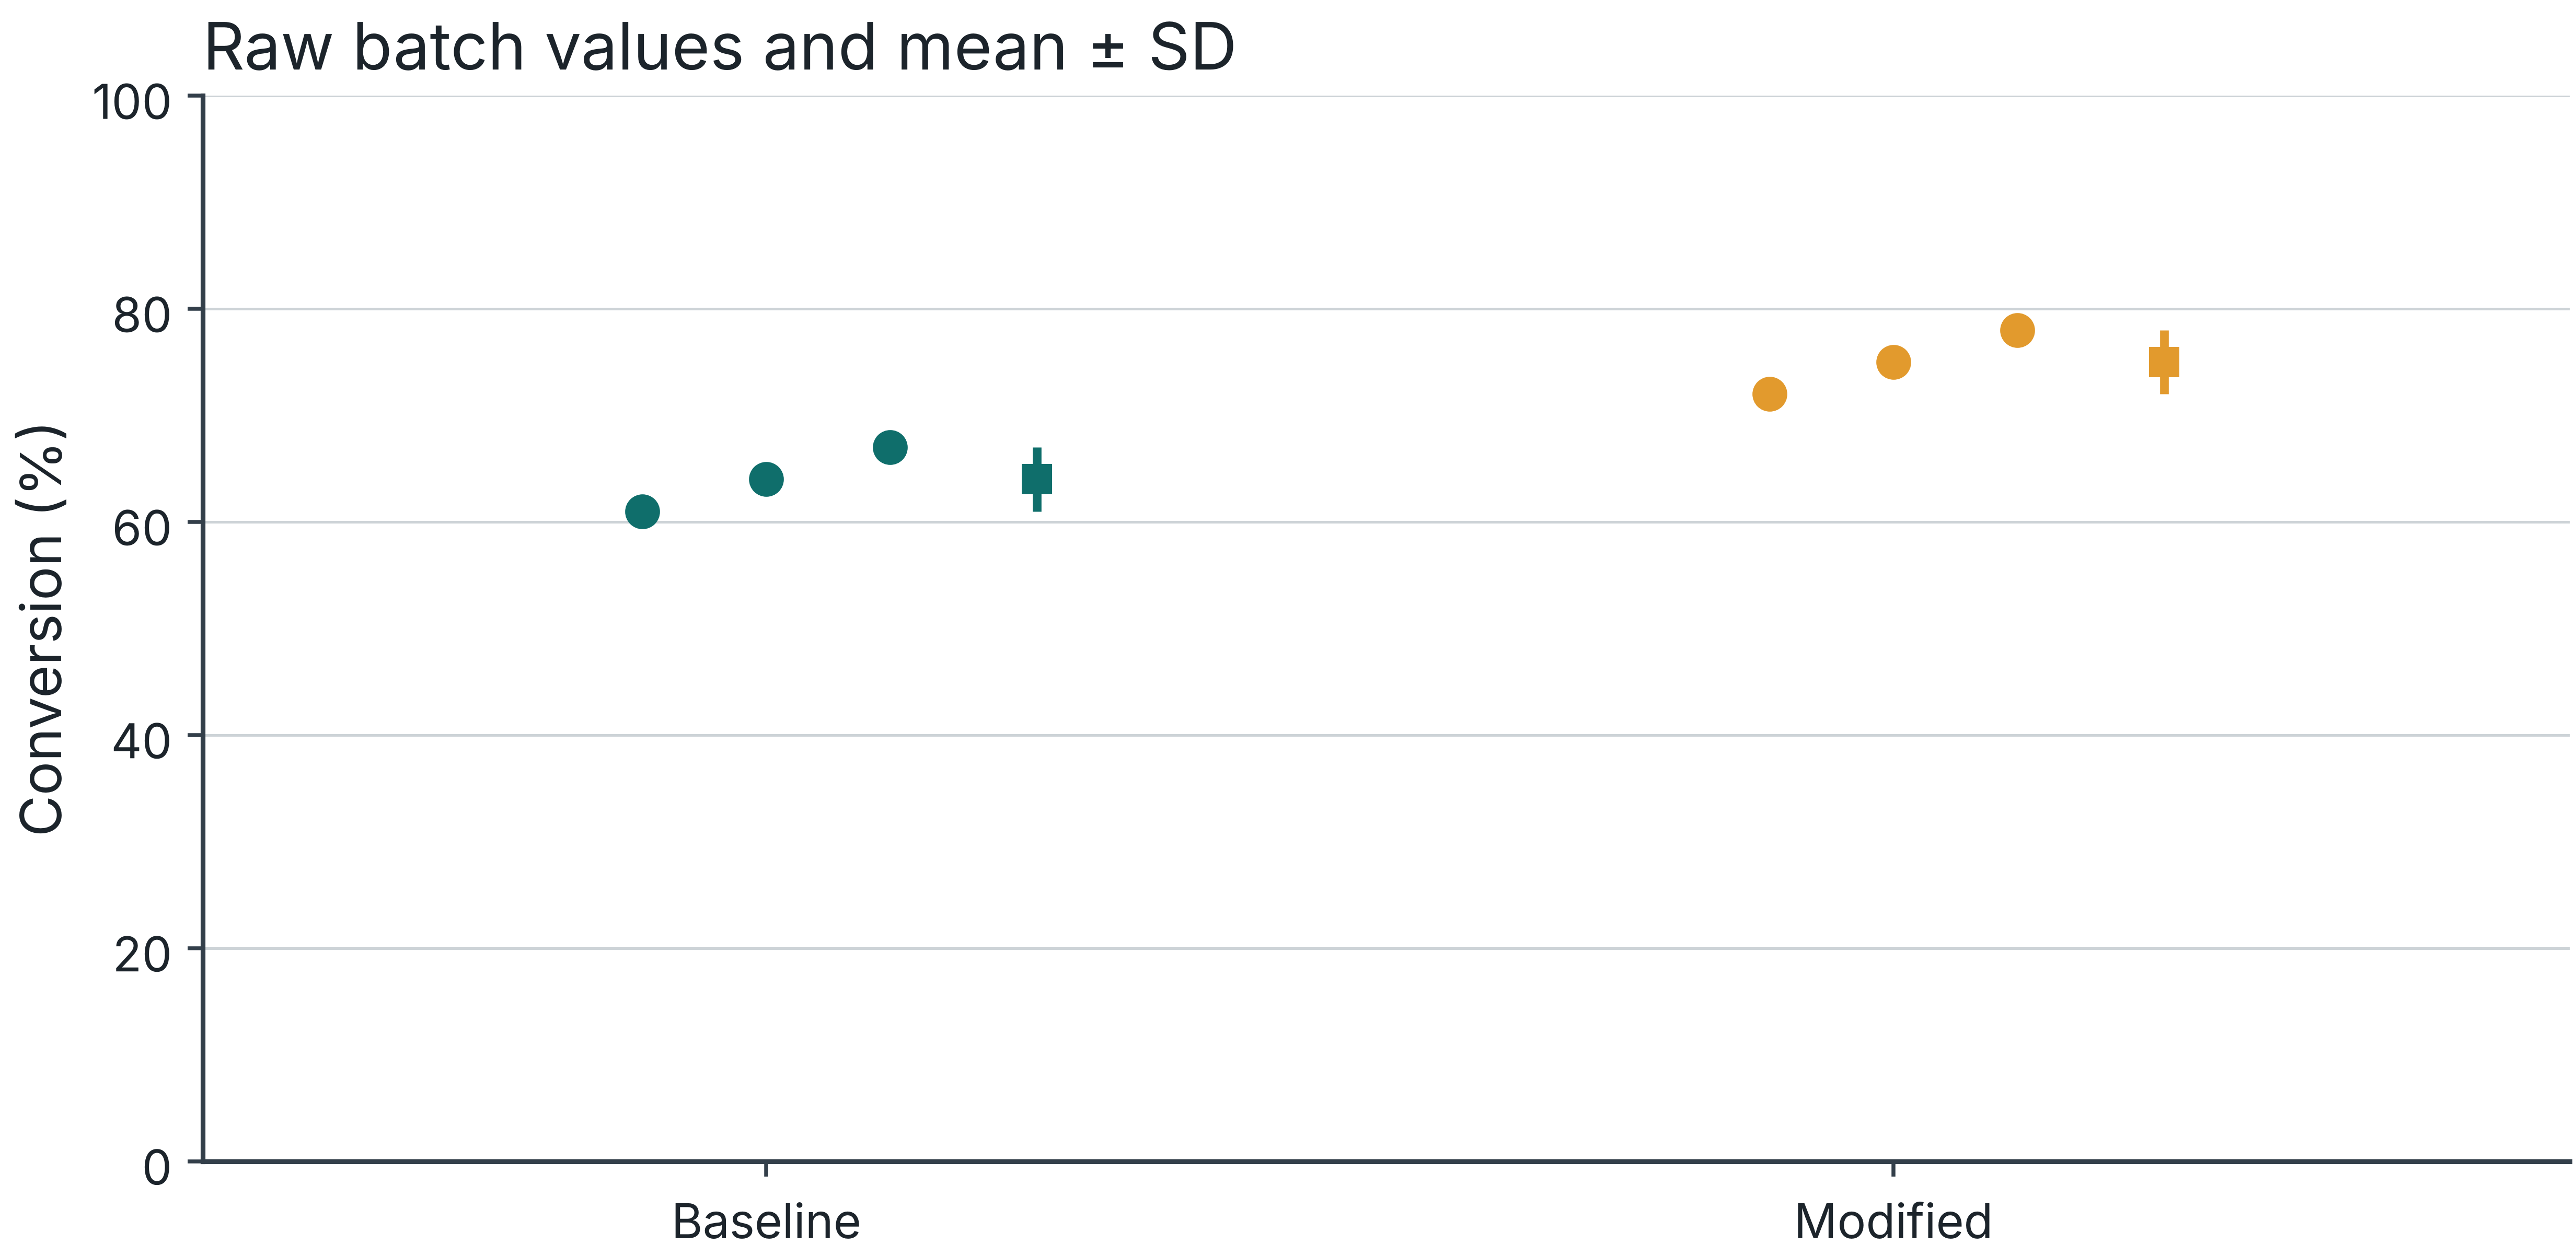
02Points show three independent catalyst batches per condition. Large markers show means. Error bars show ±1 SD.
03The comparison covers one feed composition. The experiment does not establish a reaction mechanism.
Synthetic teaching data. Report the remaining operating conditions in the final caption or linked methods.
A caption should support independent reading
01What system and comparison does the figure show?
02Which conditions, units and normalization apply?
03What is n, and what counts as an independent replicate?
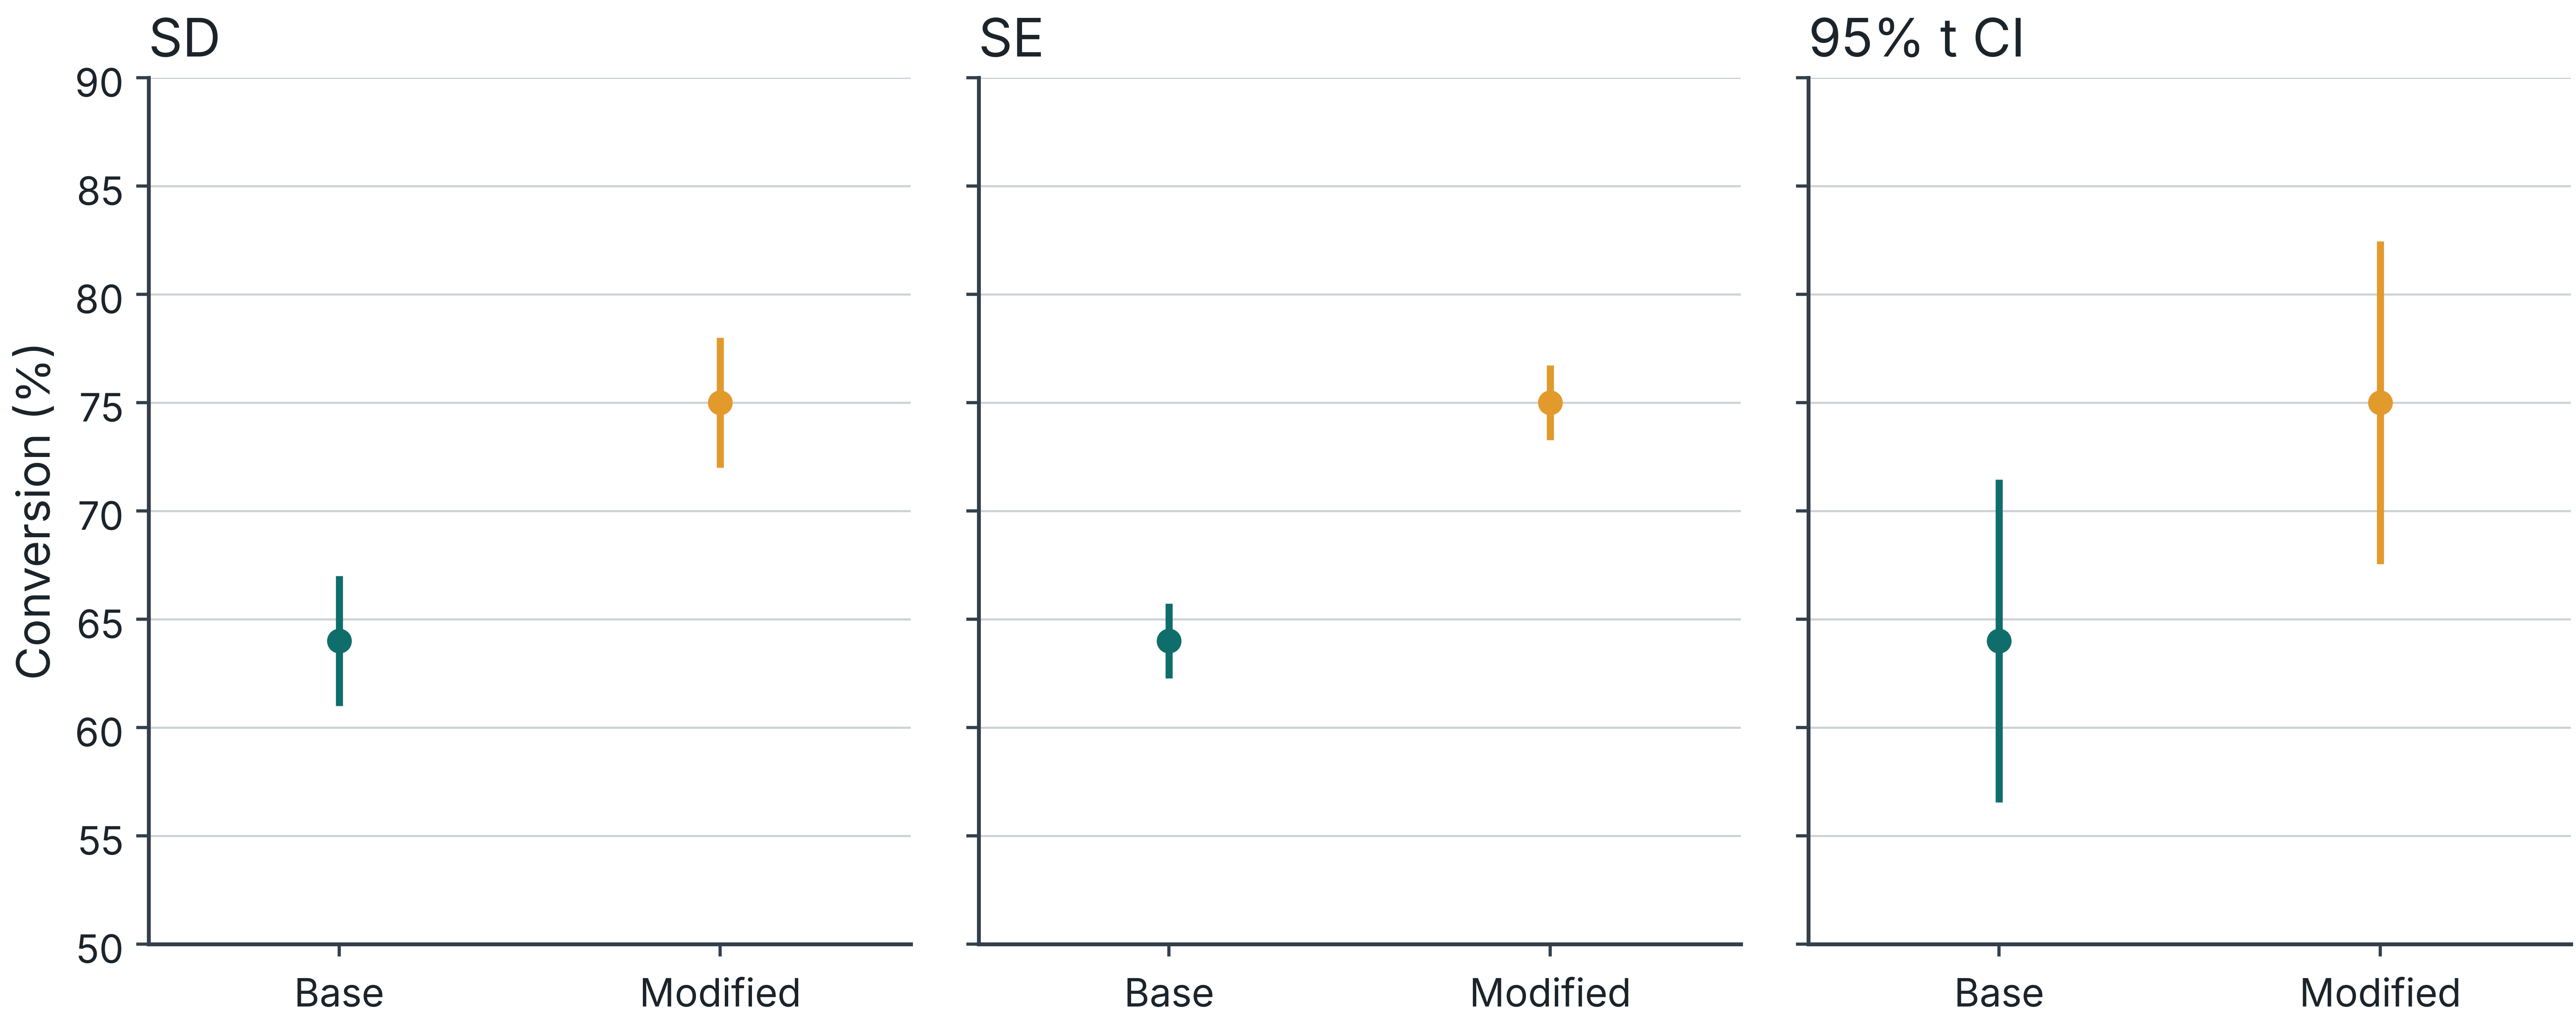
04What do points, lines and uncertainty marks mean?
Tables preserve exact values and conditions
01Put units in the headers.
02Use precision that the measurement supports.
03Distinguish missing, not measured and not applicable.
04Keep each row’s basis of comparison explicit.
Figure integrity and reproducibility
01Keep raw data unchanged and document exclusions.
02Generate the figure from a saved script.
03Use consistent scales for panels meant for comparison.
04Retain source files, processing steps and permissions.
Technical repeats do not create new batches
01Design A: one catalyst batch, measured nine times.
02Design B: three independently prepared batches, each measured three times.
03For between-batch variation, Design B has n = 3 independent batches.
A readable export is part of the evidence
01Check the figure at its intended publication size.
02Use the lab palette and redundant markers or labels.
03Export vector files or raster files at ≥600 dpi.
04Check embedded PDF fonts and exclude Type 3 fonts.
Reading and policy sources
01Krzywinski and Altman: Error bars
02I&EC Research: Author Guidelines