Session 2 · Student worksheets
← All sessions · Download Word workbook
Type answers below, download a text copy, or print this page. Drafts are saved only in this browser when browser storage is available. They are not submitted to the instructor. Avoid shared devices for private answers.
พิมพ์คำตอบในช่องด้านล่าง แล้วดาวน์โหลดเก็บไว้ได้ คำตอบยังไม่ได้ส่งให้ผู้สอน ส่วน exit ticket ให้ส่งผ่านลิงก์ท้ายใบงาน
Worksheet 2A Figure redesign
14 October 2026 • 10 minutes
The figure below reports the same catalyst case. Identify missing information, then design a figure that supports a precise comparison. You may sketch on the back of this page.
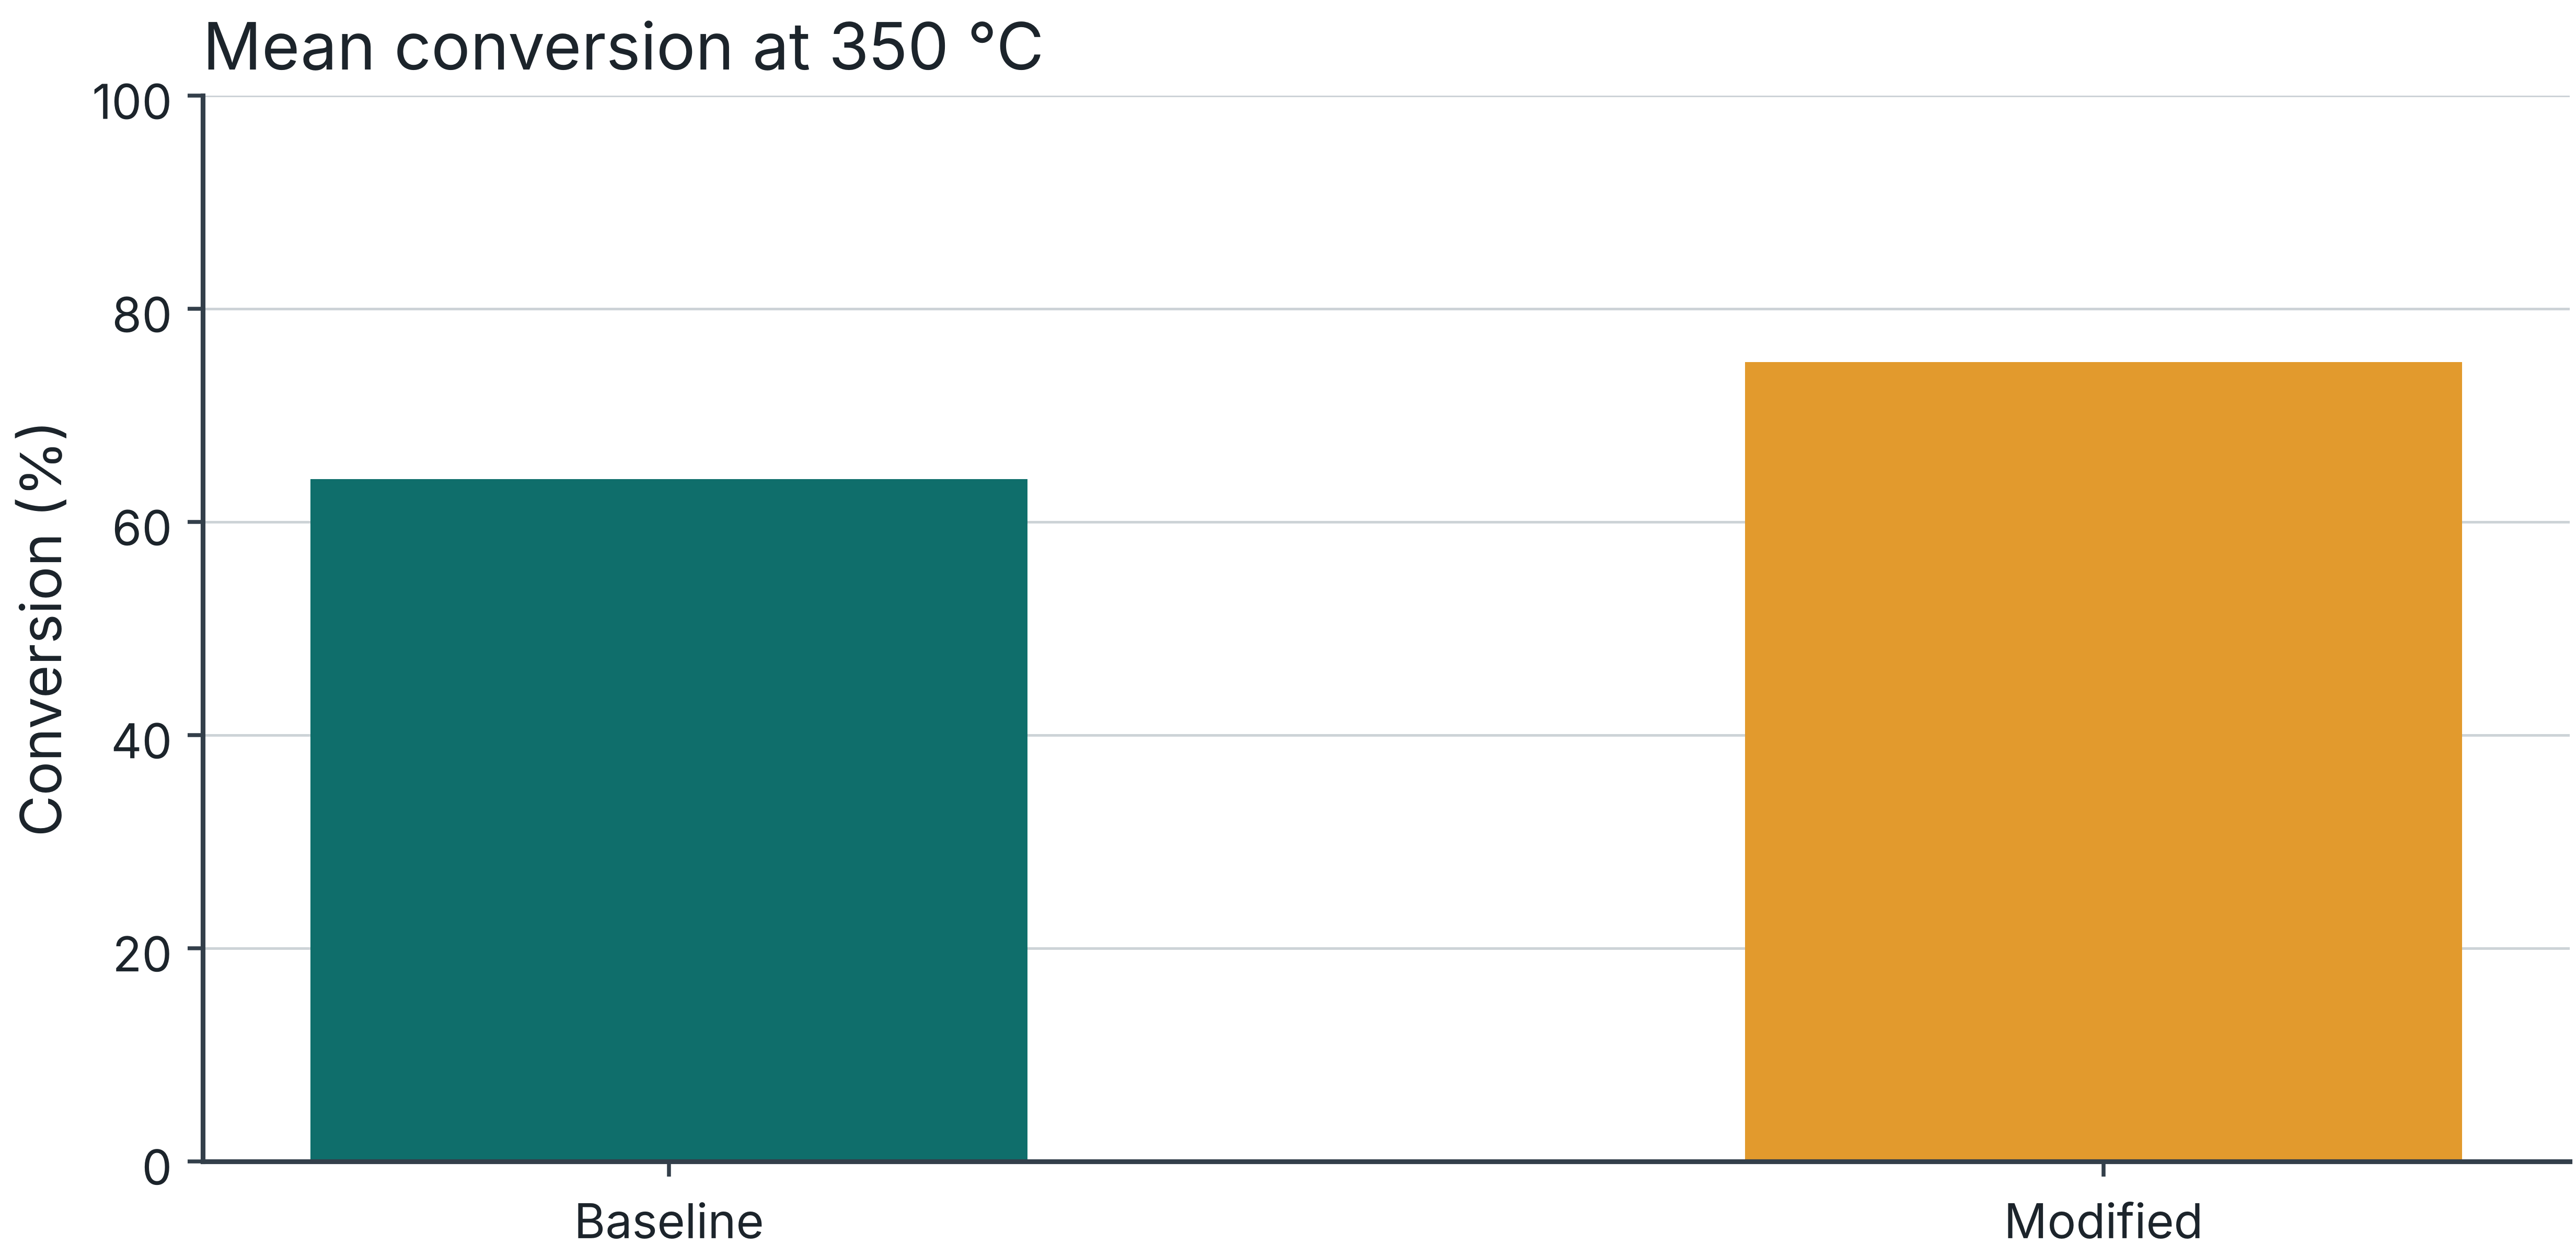
At 350 °C, independent batch values are baseline 61, 64, 67% and modified 72, 75, 78%. Conditions: 1 bar, 0.50 g catalyst, 100 standard cm³/min, 10 mol% A in inert gas. All values are synthetic.
Claim and display choice
Caption including conditions n and uncertainty
Peer check: scientific question / axes and units / independent observations / uncertainty definition / reproducibility.
Worksheet 2B Uncertainty and prediction
Use the same synthetic data. Keep percentage points distinct from relative percent.
| Quantity | Baseline | Modified |
|---|---|---|
| Mean conversion (%) | ||
| Sample SD (percentage points) | ||
| SE of the mean (percentage points) | ||
| 95% t interval for the mean (%) |
For this exercise assume independent, approximately normal observations. n = 3 per group. SE = SD / √n. Use t = 4.303 with 2 degrees of freedom. State what these assumptions leave uncertain.
Yield
At 350 °C, selectivity values paired with conversion are baseline 88, 89, 90% and modified 88, 87, 86%. Calculate each run’s yield = conversion × selectivity / 100, then average.
Prediction
Observed conversion = 20, 35, 50, 65, 80%. Predicted conversion = 25, 40, 55, 70, 85%. Calculate residuals as predicted minus observed. Explain why high correlation does not establish accuracy.
Exit ticket
Which uncertainty measure fits your scientific question, and why?